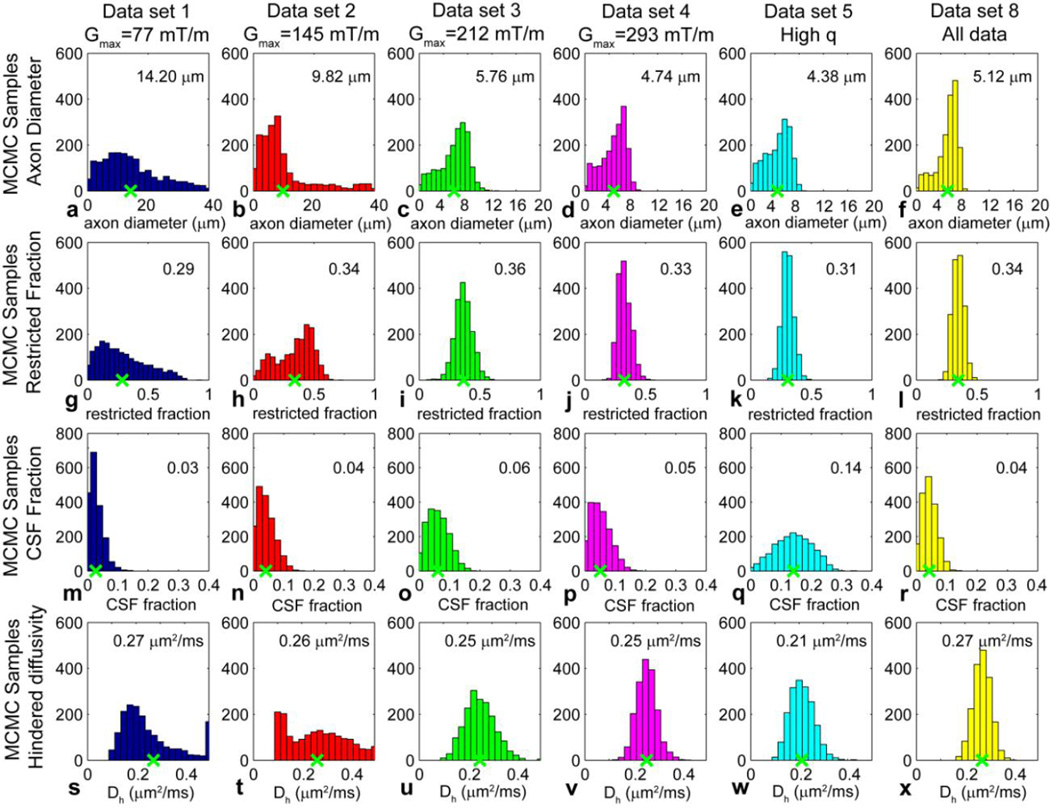
Figure 1.
Posterior distributions on (a–f) axon diameter a, (g–l) restricted fraction fr, (m–r) CSF fraction fcsf, and (s–x) hindered diffusion coefficient Dh from a representative voxel in the body of the corpus callosum for data from subject 1 acquired at different Gmax and q: (a, g, m, s) data set 1 (Gmax = 77 mT/m); (b, h, n, t) data set 2 (Gmax = 145 mT/m); (c, i, o, u) data set 3 (Gmax = 212 mT/m); (d, j, p, v) data set 4 (Gmax = 293 mT/m); (e, k, q, w) data set 5 (high q values); and (f, l, r, x) data set 8 (all data). The mean axon diameter, restricted fraction, CSF fraction, and hindered diffusion coefficient for each histogram is indicated by the green x along the x-axis and numerical value at the top right of each histogram. The bin size was set to 2 µm for the axon diameter estimates in (a) and (b) and 0.8 µm for the axon diameter estimates in (c), (d), and (e); 0.05 for the restricted fraction estimates in (g–l); 0.02 for the CSF fraction estimates in (m–r); and 0.025 µm2/ms for the hindered diffusion coefficient estimates in (s–x).

