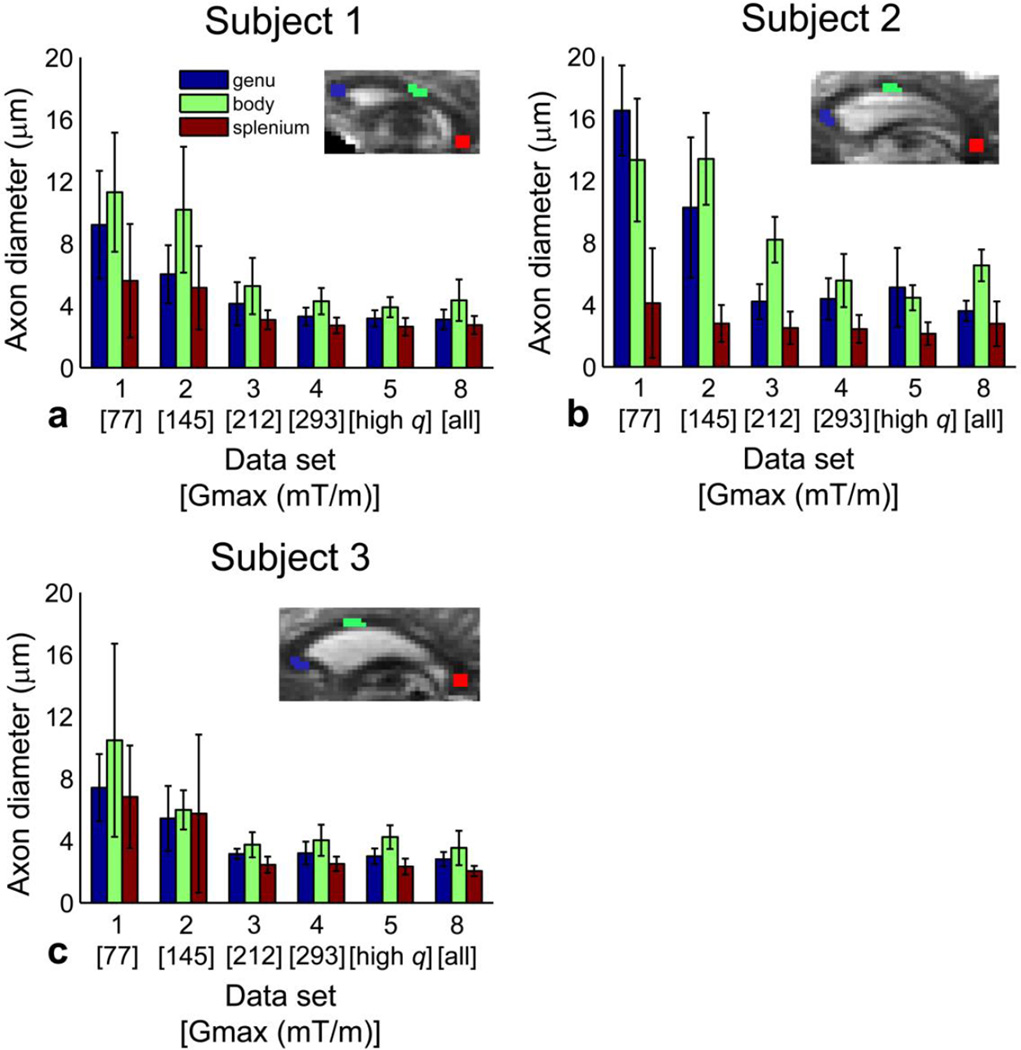
Figure 2.
Effect of Gmax and q on mean axon diameter estimates in all three subjects. Mean and standard deviation of axon diameter estimates for data sets 1–5 and 8 within the genu, body, and splenium ROIs in the midline sagittal slice of the corpus callosum for (a) subject 1, (b) subject 2, and (c) subject 3. (Insets) Delineation of ROIs placed in the genu, body, and splenium of the midline sagittal slice of the corpus callosum overlaid on representative b = 0 images for each subject.

