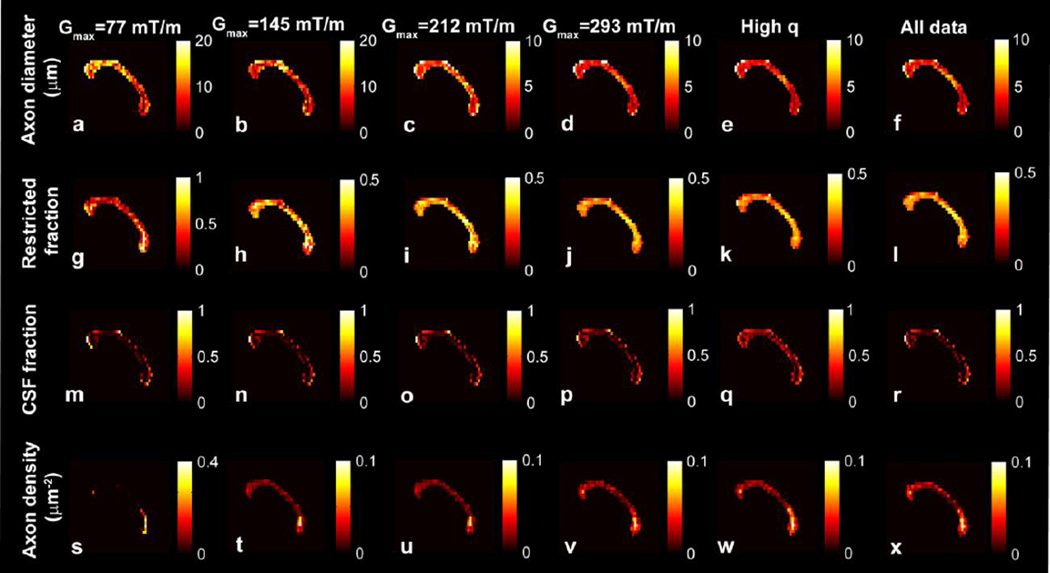
Figure 4.
Voxel-wise estimates in the midline sagittal slice of the corpus callosum of subject 1 for (a–f) axon diameter, (g–l) restricted fraction, (m–r) CSF fraction, and (s–x) axon density for different Gmax, high q and all data (data sets 1–5 and 8). The voxel-wise axon diameter a, restricted fraction fr, and CSF fraction fcsf values represent the means of the posterior distribution on a, fr, and fcsf, respectively. The axon density represents the restricted fraction weighted by the cross-sectional area calculated from the mean axon diameter (23).

