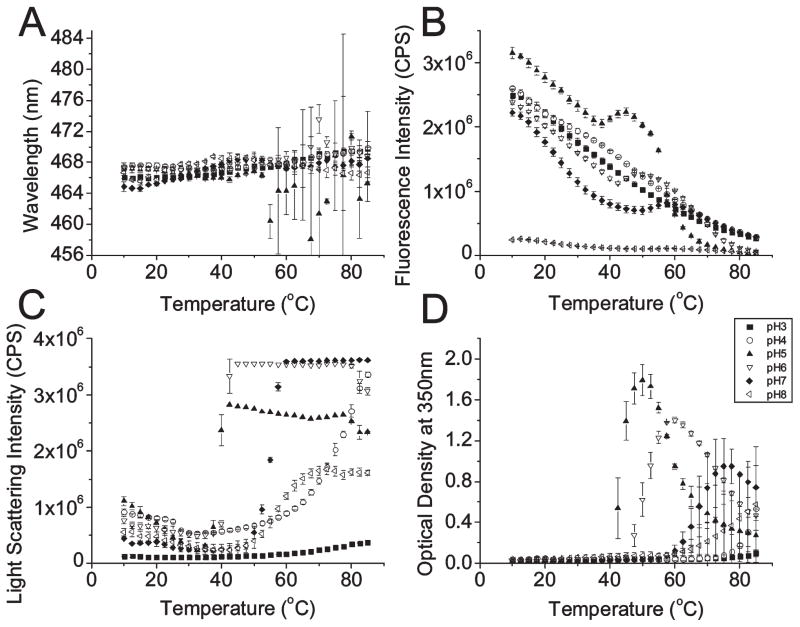
Figure 5.
IpaD ANS and light scattering studies. ANS fluorescence wavelength peak position (A) and intensity (B) monitored from10 to 85 °C. Light scattering intensities at 275 nm (C) and optical densities at 350 nm were measured under the same conditions. Error bars are the standard deviations from at least three trials: (■) pH3, (○) 4, (▲) 5, (▽) 6, (◆) 7, and (left-pointing triangles) 8.

