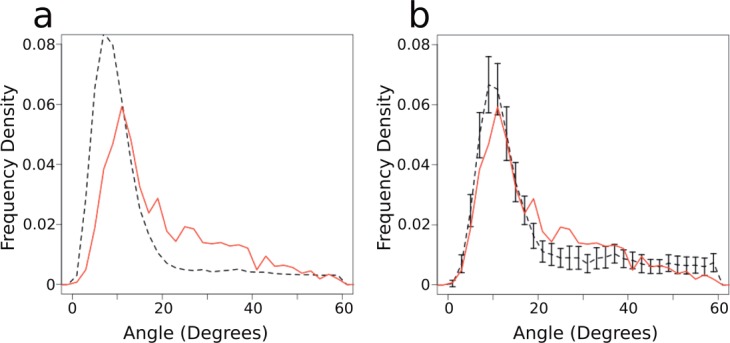
Figure 1.

Kink angle distributions. (a) The distribution of maximum angles in all membrane (solid red) and all soluble (dashed black) helices. (b) The distribution of maximum angles in length matched sets of membrane and soluble helices. The soluble values are means of 50 samples which are matched to the same length distribution as the membrane helices. Again, the solid red line shows the membrane distribution, while the dashed black line shows the soluble distribution. Bars show 2 s.d. from 50 samples. Frequency density is the normalized frequency of helix length, such that the area beneath the graph is equal to one. [Color figure can be viewed in the online issue, which is available at wileyonlinelibrary.com.]
