
Figure 2.
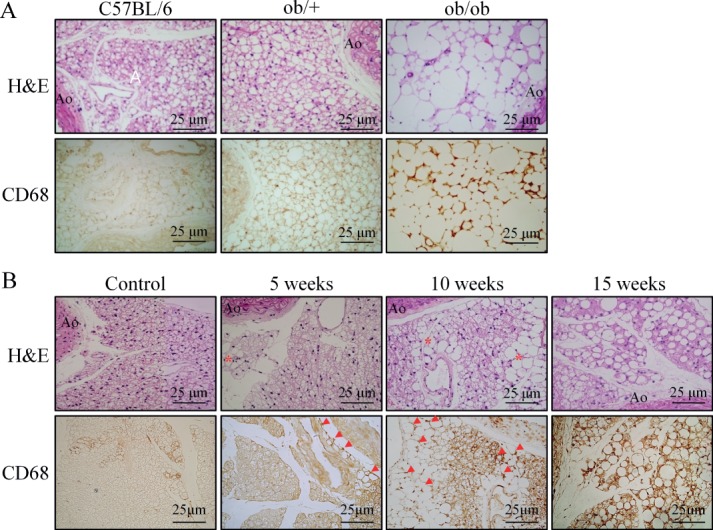
Characteristics of PVAT in diabetic and HFD-fed obese mice. (A) H&E-stained sections of PVAT surrounding the abdominal aorta of control (C57BL/6), ob/+ and ob/ob mice. (B) Time course changes of PVAT morphology in mice fed HFD for 5, 10 and 15 weeks. Representative images are from five or six independent experiments: Ao, abdominal aorta. Bottom in each group: (A) immunohistochemical staining for macrophages (CD68+) in PVAT of control (C57BL/6), ob/+ and ob/ob mice. (B) Time course of macrophage infiltration in PVAT of HFD-fed mice. Representative images are from five or six independent experiments: *area where adipocytes are enlarged; arrows, macrophage staining.