
Fig 1.
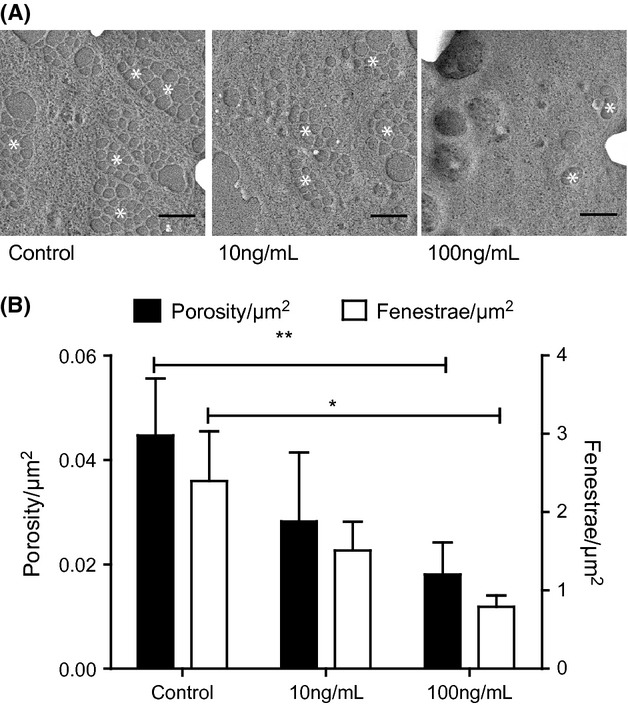
Thrombospondin 1 (TSP1) induced LSEC defenestration. (A) SEM images of LSEC after treatment with different doses (0 ng/ml, 10 ng/ml and 100 ng/ml) of TSP1 for 12 h. Scale bars represent 1 μm. White asterisks (*) indicate fenestrae or clusters of fenestrae (sieve plates). (B) Porosity/μm2 (black bars, represent fenestrae area) and Fenestrae number/μm2 (white bars, represent the absolute number of fenestrae) observed in LSEC after treatment with different doses of TSP1 (* represents P < 0.05 with Student's t-test).