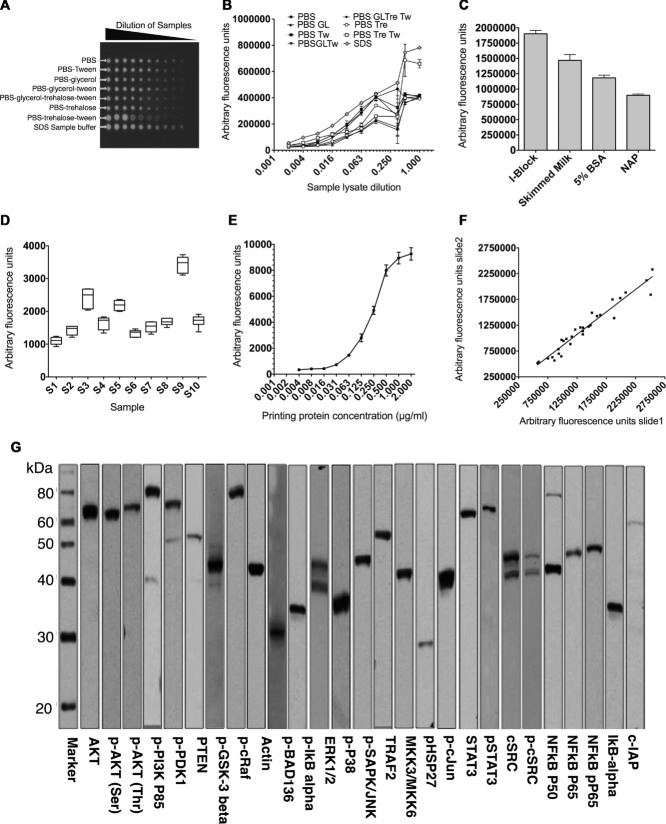
Figure 1.
Validation of reverse phase protein microarray. (A) Positive control lysate was prepared from SK-Hep-1 cells transfected with WT or mutant TNFR1 stimulated with IL-1 (10 μg/mL), IL-6 (10 μg/mL), and TNF-α (50 ng/mL) or LPS (20 μg/mL); cells were then lysed and the lysates pooled. The lysates were serially diluted in eight different printing buffers, arrayed on 16- pad nitrocellulose-coated slides and probed for β-actin by RPPA using infrared reporter-conjugate. (B) Multiple printing buffers were used to print the positive lysates on nitrocellulose slides and feature signal intensities were assessed by probing the slide for β-actin using RPPA. Data are shown as mean of three replicates and the experiment was repeated three times with similar results. All fluorescent signals are reported as arbitrary fluorescence units (AFU). (C) Fluorescent signal intensities obtained for RPPA analysis using a range of blocking buffers. Data are shown as mean = SD of three samples in one experiment representative of three independent experiments. (D) Intraslide reproducibility of RPPA: ten different lysates (S1-S10) were printed (replicate n = 6) on 16-pad slides. A box and whisker plot is shown, with median represented by a black line within the box representing the interquartile range, using Tukeys estimation for whisker length. The coefficient of variation (%) is indicated for each sample. (E) Feature-associated β-actin signal associated with protein concentration of source lysate, up to 2 μg/mL. Positive control lysates were serially diluted and spotted on nitrocellulose slides. The slides were probed by RPPA for β-actin, p-AKT Threonine, p-AKT serine, and p-PDK1. Data are shown as mean ± SD of 18 samples from one experiment representative of three independent experiments. (F) Interslide reproducibility between signals from the same lysates (n = 30) printed on two different nitrocellulose slides and probed for RPPA (R2 = 0.942). (G) Primary antibodies were validated using western blotting and strip images are shown for selected antibodies in this study. Images are representative of two independent experiments.

