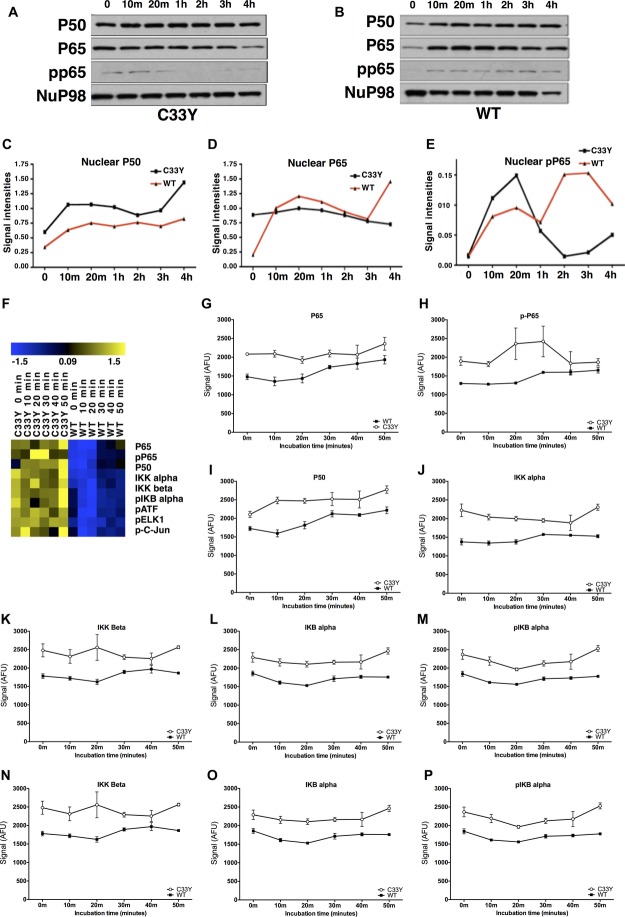
Figure 4.
NF-κB activation in TNFR1-C33Y-expressing SK-Hep-1 cells. (A) TNFR1-C33Y-transfected or (B) TNFR1-WT-transfected, SK-Hep-1 transfectants were stimulated with 50 ng/mL TNF-α for different times (0, 10 min, 20 min, 1, 2, 3, and 4 hours), lysed and assessed for NF-κB pathway intermediates by chemiluminescent imaging using SDS-PAGE and western blot. Representative results of three experiments are shown. NuP98 was used as internal control normalizer of protein loading for nuclear lysate samples. Densitometric quantification of (C) nuclear P50, (D) nuclear P65, and (E) nuclear phosphoP65 were obtained using the RPPA method. Data are shown as mean ± SD of three samples pooled from three independent experiments. (F) Heat maps representing NF-κB signaling intermediates determined by RPPA in SK-Hep-1 transfectants stimulated with 10 ng/mL TNF-α for various times (0, 10, 20, 30, 40, and 50 min). Each column represents separate SK-Hep-1 cell nuclear lysates organized by the transfected variant, and then by time of stimulation; each row represents a separate signaling molecule. The blue to yellow heat map indicates relative abundance from lower and higher levels, respectively. Signal values represented on the color scale for the heat maps are log2 transformed from the AFU obtained. (G–P) Graphical representation of the signals visualized on the heat map (F): (G) P65, (H) p-P65, (I) P50, (J) IKKα, (K) IKKβ, (L) IKBα, (M) p-IKBα, (N) p-ATF, (O) p-ELK1, and (P) p-C-Jun. All fluorescent signals are reported as arbitrary fluorescence units (AFU), with β-actin signal normalization. Data are shown as mean ± SD of three samples pooled from three independent experiments. Statistical analysis of RPPA data is presented in Supporting Information Table 3.

