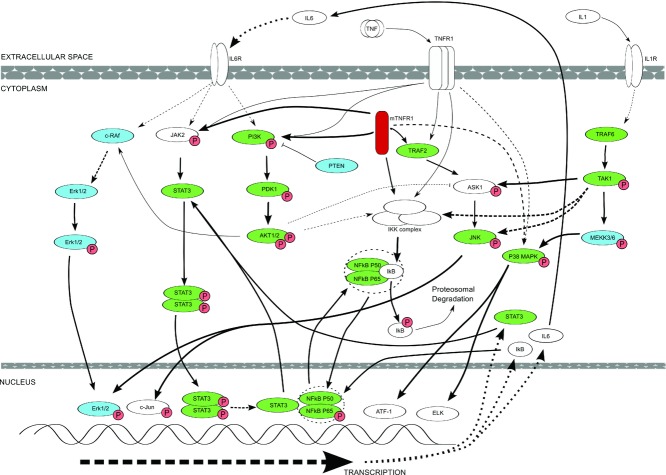
Figure 6.
Diagrammatic representation of key alterations in signaling molecule expression and phosphorylation states as determined by examination of both SK-Hep-1 cell line models and TRAPS patient PBMCs expressing the C33Y TNFR1 variant, compared with cells expressing the WT TNFR1, or normal control sample PBMCs. The diagram does not show every target examined during this research project, but only indicates known signaling pathway interactions between different molecules. Dashed lines represent interactions involving more than one intermediate. Thick lines indicate where there is likely to be increased interaction and activation of downstream molecules or events. Signaling intermediates highlighted in green are those that are significantly upregulated in C33Y TRAPS patients’ PBMCs compared with those of healthy control individuals. The signaling intermediates highlighted in blue show no significant difference in levels between patient and control PBMCs.

