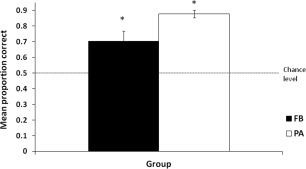
Figure 3.

Behavioral data. Overall learning performance measured by mean proportion correct predictions plotted separately for feedback (FB) and paired associate (PA) groups. For the FB group, the black bar represents performance during the final 50 trials of the feedback training phase (i.e., trials 351–400) while for the PA group, the white bar represents performance during the test phase. Error bars are standard errors. An asterisk indicates where performance was significantly different from chance (50%).
