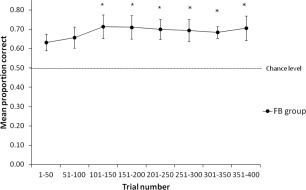
Figure 4.

Behavioral data. Learning performance in the feedback (FB) group across 400 feedback‐based training trials. Black circles represent performance averaged across every 50 trials. Error bars are standard errors. Dashed line indicates chance level. An asterisk indicates where performance was significantly different from chance (50%).
