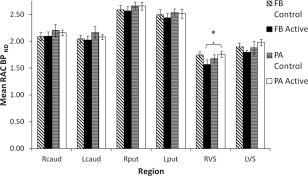
Figure 5.

11C‐Racolpride binding data. Mean 11C‐raclopride binding potential (RAC BPND) across different regions in the striatum, plotted separately for feedback (FB) and paired associate (PA) groups and for whether the task was ‘active’ (i.e., FB or PA) in that group or ‘control’. For the FB group, the grey bars represent mean RAC BPND for the control condition and the black bars represent mean RAC BPND for the active FB condition. For the PA group, the blue bars represent mean RAC BPND for the control condition and the white bars represent mean RAC BPND for the active PA condition. A decrease in RAC BPND is indicative of greater release of synaptic dopamine in that region. Error bars are standard error. R = right, L = left. Caud = caudate, put = putamen, VS = ventral striatum. An asterisk indicates a significant comparison.
