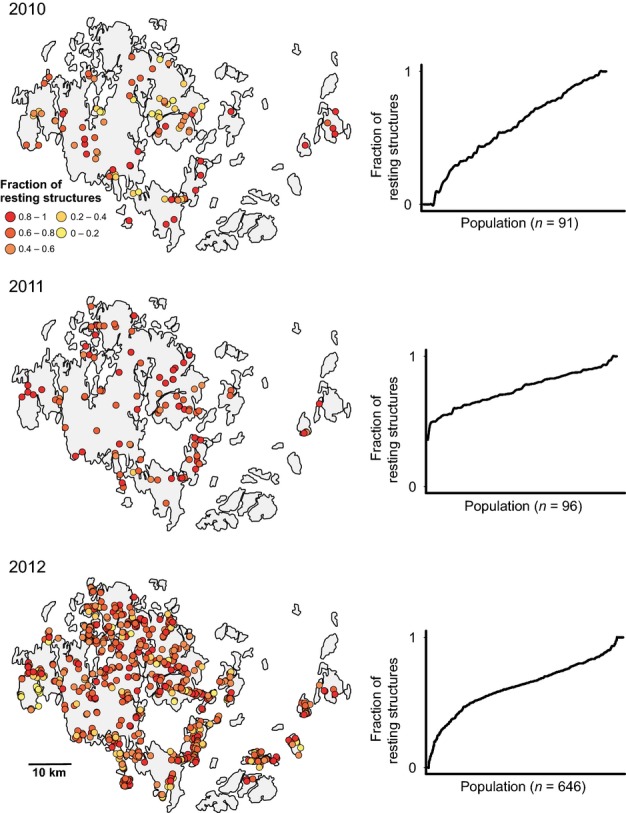
Fig 4.

Spatial variation in the production of resting structures (i.e. fraction of infected leaves with resting structures) by the powdery mildew Podosphaera plantaginis for each of three years. The graphs on the right show the distribution of the fraction of infected leaves with resting structures across populations. For each year, the fraction of infected leaves with resting structures is highly variable among populations, but particularly so in 2010 and 2012.
