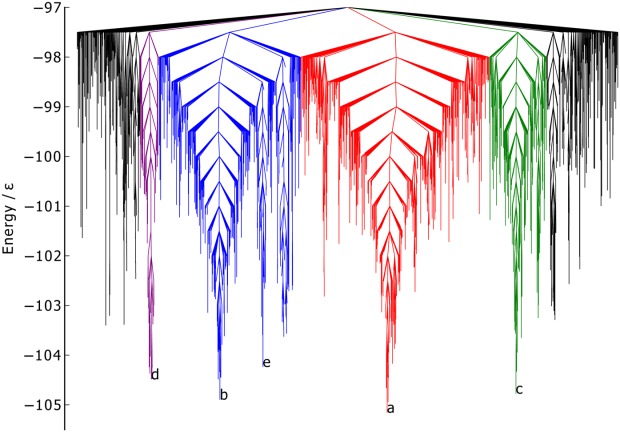
Figure 1.

Disconnectivity graph of BLN-69,Ut = 97.0ε, Nsp = 1611. The color scheme is chosen to distinguish between energetic funnels. Labeled minima correspond to the global minimum and low-energy minima separated from the global minimum and one another by large kinetic barriers and are shown in Figure 2.
