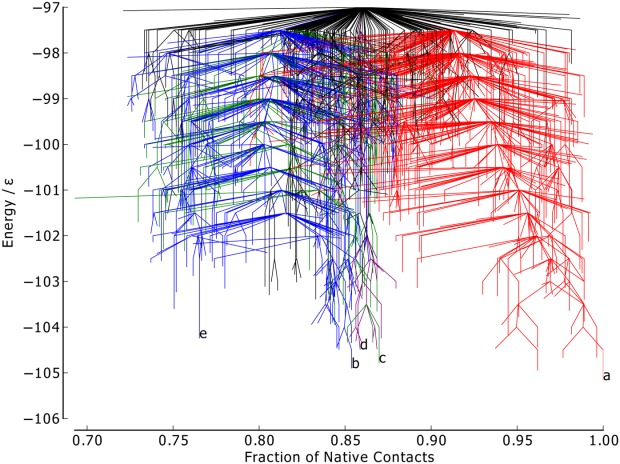
Figure 3.

Metric disconnectivity graph of BLN-69, Ut = − 97.0ε, Nsp = 1611, with fraction of native contacts used as an order parameter. The color scheme and labels are as used in Figure 1. [Color figure can be viewed in the online issue, which is available at http://wileyonlinelibrary.com.]
