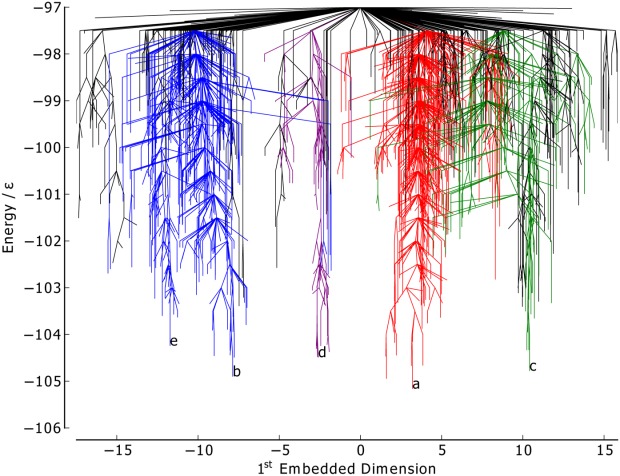
Figure 9.

Metric disconnectivity graph of BLN-69, Ut = −97.0ε, Nsp = 1611, with the first embedded dimension for  from Isomap analysis used as an order parameter in units of σ. The color scheme and labels are as used in Figure 1. [Color figure can be viewed in the online issue, which is available at http://wileyonlinelibrary.com.]
