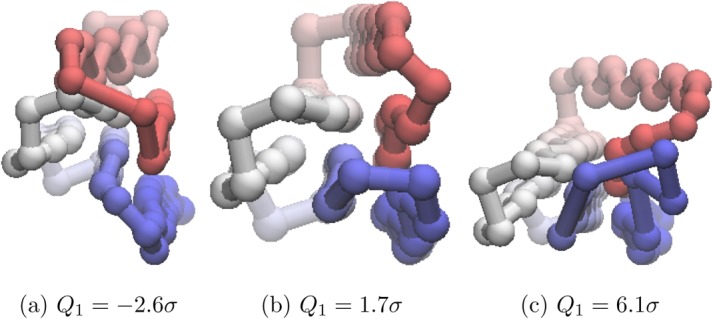
Figure 17.

Different values of Q1 for Ut = − 54.0ε projected onto the structure of the global minimum of Gō-69. For the global minimum, Q1 = −0.6σ. The beads are colored from red to blue (N-terminus to C-terminus). An animated version of this projection is available as Supporting Information. [Color figure can be viewed in the online issue, which is available at http://wileyonlinelibrary.com.]
