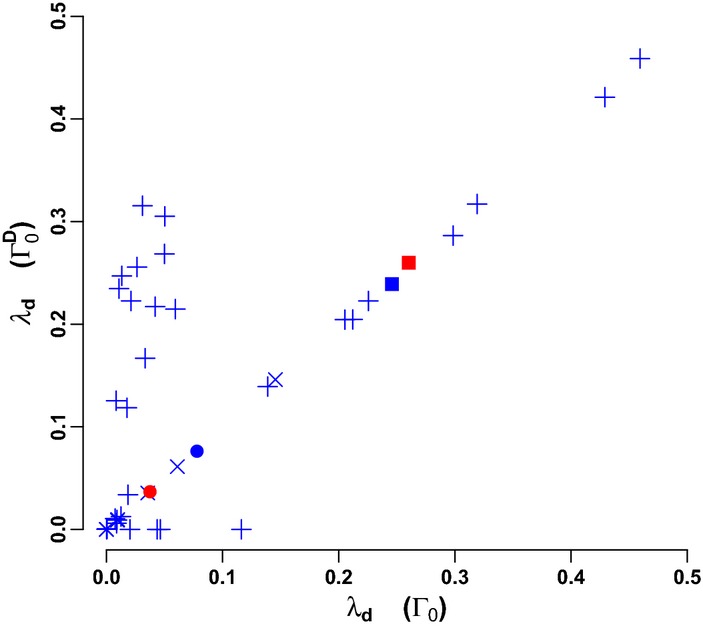
Figure 3.

Effect of recycling on ecosystem stability. Ecosystem vulnerability λd with detritus interactions present (Γ0D) compared with system vulnerability after detritus interactions were removed (Γ0). The Antarctic dry tundra (closed circle) and wet tundra (closed square) are shown in red. Their inferred-flux counterparts are shown in blue, as well as the 39 soil food webs which are all based on inferred fluxes. The soil food webs are from agricultural and native soils (cross signs) (Hendrix et al. 1987; Hunt et al. 1987; Andrén et al. 1990; de Ruiter et al. 1993) and from soils in two vegetation successions (plus signs) (Neutel et al. 2007). For details see Table S3. Regression analysis: N = 43, R2 = 0.47, P < 10−6; regression analysis with only the systems where stability was not affected by detritus interactions: N = 25, R2 = 0.99, P < 10−15.
