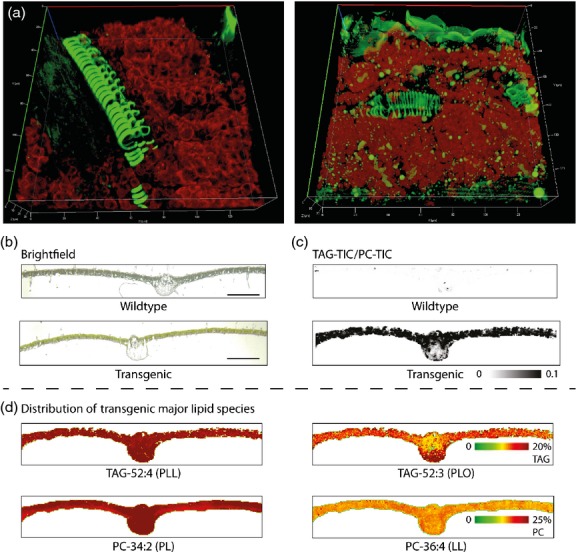
Figure 4.

Accumulation of lipid droplets and spatial distribution of different triacylglycerol (TAG) molecular species within transgenic leaf tissue. (a) 3D reconstructed z-stacks of confocal images from wild-type (left) and transgenic (right) leaf tissue. Neutral lipids including TAG, stained with BODIPY, appear as green droplets within the leaf mesophyll cells that contain visible chloroplasts (red autofluorescence). Note that non-TAG features also fluorescing green include the vascular bundle and leaf epidermis. (b) Bright-field microscopy images of wild-type (upper) and transgenic (lower) leaf cross-sections subsequently used for MALDI-Orbitrap imaging. Scale bars correspond to 1000 microns. (c) Ratio of TAG total ion counts (TIC; all TAG molecular species summed at each analysed position) to PC-TIC as detected by MALDI-Orbitrap imaging in wild-type (upper) and transgenic (lower) leaf cross-sections. (d) Spatial distribution of selected dominant TAG and PC species across a transgenic leaf cross-section as observed by MALDI-Orbitrap.
