. 2014 Oct 27;34(2):317–342. doi: 10.1002/sim.6343
© 2014 The Authors. Statistics in Medicine published by John Wiley & Sons Ltd.
This is an open access article under the terms of the Creative Commons Attribution-NonCommercial-NoDerivs License, which permits use and distribution in any medium, provided the original work is properly cited, the use is non-commercial and no modifications or adaptations are made.
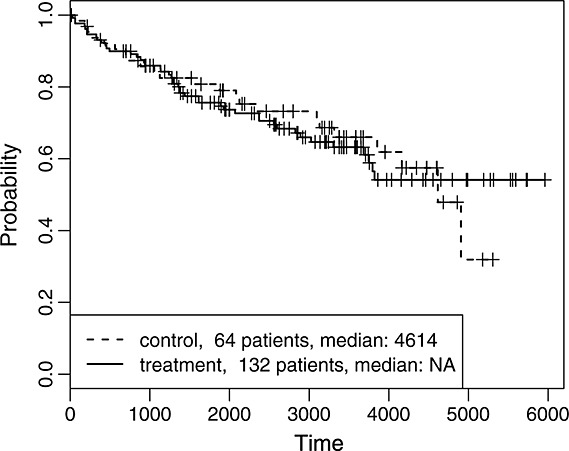
Figure 1.

The Kaplan–Meier curves for two arms in the ER data set.
