Figure 4.

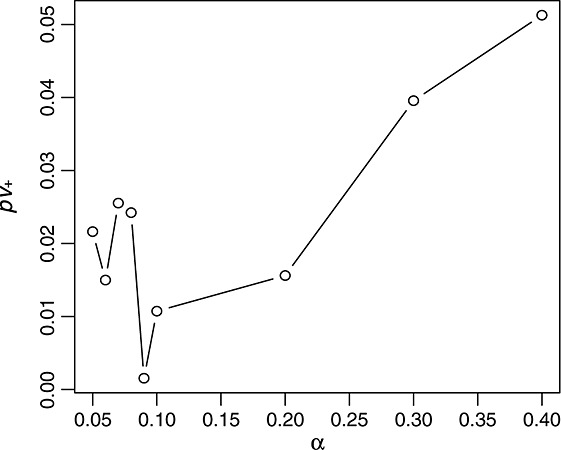
Minimal pv+'s given different α values based on results in the CHOP data set (see the case study in Section 5). Note that no stratification was generated given α = 0.50, and thus, no associated pv+ is visualized.

Minimal pv+'s given different α values based on results in the CHOP data set (see the case study in Section 5). Note that no stratification was generated given α = 0.50, and thus, no associated pv+ is visualized.