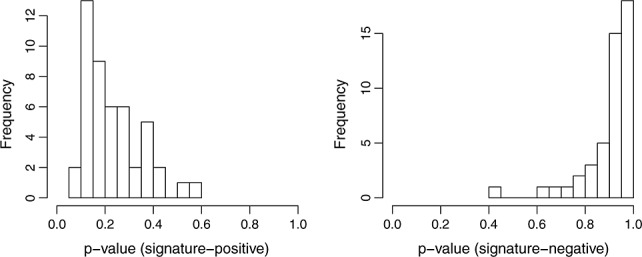
Figure 8.

The distributions of CV p-values for AIM in the ER data set: The left histogram is for pv+ and the right one for pv−. Note that because the method only returned valid results from 47 out of the 100 random splits but exited for other splits due to internal errors in the package AIM, illustrations and discussion were only based on the valid results.
