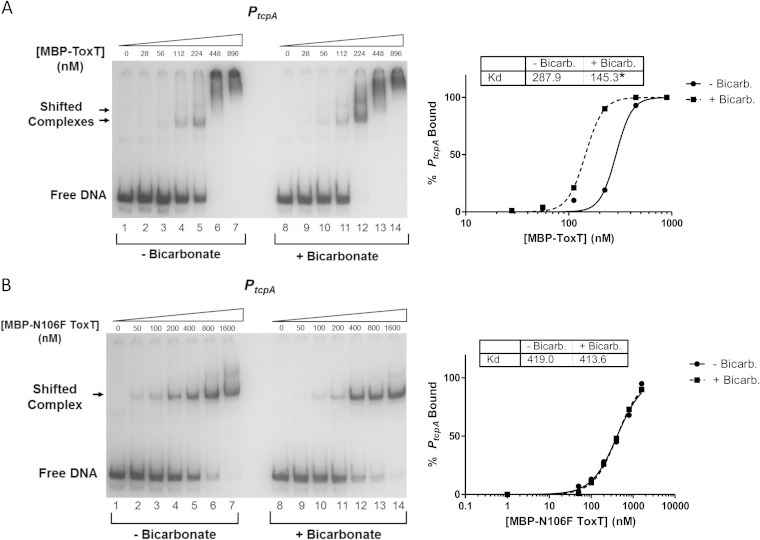
FIG 10.
MBP-ToxT N106F has no change in binding affinity to PtcpA after the addition of bicarbonate. MBP-ToxT WT and N106F binding to PtcpA was analyzed using EMSA as previously described (37). Autoradiographs of EMSAs presented are representative of three or more independent experiments. Panel A is taken from our previous study of the effects of bicarbonate on ToxT binding (37). (Left) Binding reactions between MBP-ToxT WT (A) or MBP-ToxT N106F (B) and PtcpA in lanes 1 to 7 took place in the absence of NaHCO3. Reaction mixtures in lanes 8 to 14 were incubated in the presence of 36 mM NaHCO3. Reaction mixtures in lanes 1 and 8 contained PtcpA DNA in the absence of MBP-ToxT. Reaction mixtures in subsequent lanes contained titrations of MBP-ToxT with the concentrations indicated above the lanes. (Right) Binding curves for the autoradiographs at the left. Densitometry of autoradiographs was performed with ImageJ software. Circles represent percentages of PtcpA bound by MBP-ToxT in the absence of bicarbonate, and the solid line corresponds to the binding curve for MBP-ToxT to PtcpA, determined by the following equation using GraphPad Prism 5 software: % bound = Bmax × [protein]h/(Kdh + [protein]h), with the Bmax constraint set to 100. The squares and dashed line represent percentages of PtcpA bound by MBP-ToxT and the binding curve, respectively, in the presence of bicarbonate. The Kd for each condition is inset, and a significant difference between the best-fit values of each data set is denoted by an asterisk (P < 0.00025).

