
Fig 6.
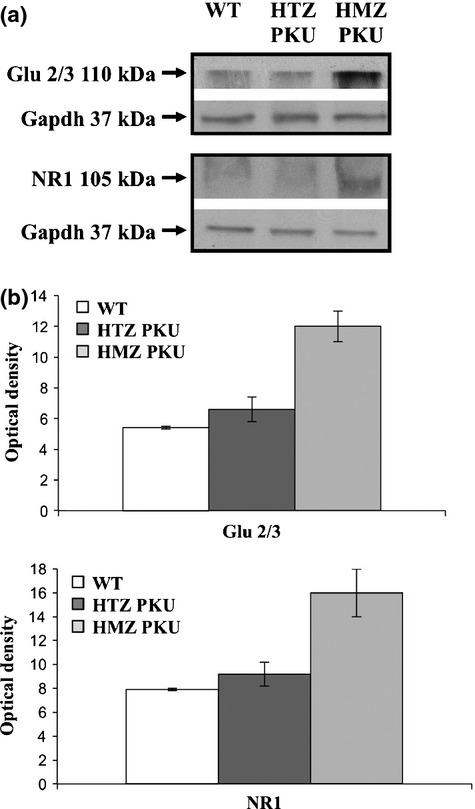
Expression of Glu2/3 and NR1 receptor subunits in PKU mouse brain. (a) Representative western blot analyses of Glu2/3 and NR1 receptor subunits performed on total protein extracts of wild-type (WT), heterozygous (HTZ PKU), and homozygous (HMZ PKU) mouse brains; Gapdh was used as loading control. (b) Densitometric analysis of Glu2/3 and NR1 receptor subunit expression performed on three independent replicates. The y-axis shows the optical density of protein expression. The results are shown as means ± SD.