
Fig 1.
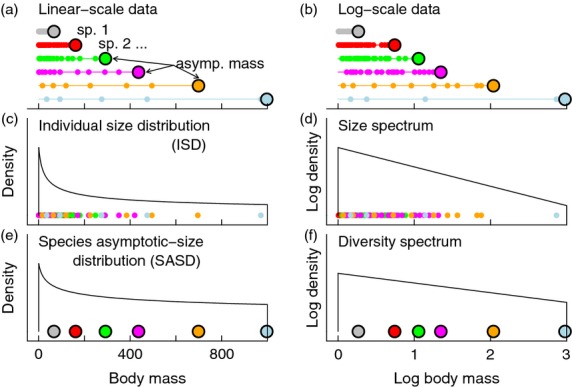
Schematic illustration of basic definitions of spectra and distributions. Each species occurring in a region has an asymptotic mass (large dots), and the individuals of that species have masses less than or equal to the asymptotic mass (small dots, linear scale, (a); separate data on the log scale, (b)). Individuals of a species are all growing towards the species asymptotic mass, indicated by the thin coloured lines in (a) and (b). The individual size distribution (ISD; c) describes how the body sizes of all individuals in the region, regardless of species, are distributed. The size spectrum (d) provides equivalent information in different form – it is the log of the distribution of log individual body sizes. The species asymptotic-size distribution (SASD; e) is a species analogue of the ISD, and the diversity spectrum (f) is a species analogue of the size spectrum – these tools indicate how species asymptotic sizes are distributed.