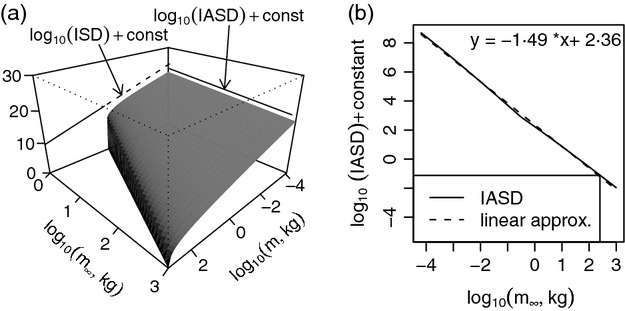
Fig 2.

(a) The joint distribution of individual mass, m, and asymptotic mass, m∞, expressed as log10(N(m, m∞)) + constant (see eqn 1) for m between megg (upper bound fish egg size) and 1000 kg and m∞ between 1 and 1000 kg. The marginal distributions, which are the individual size distribution (ISD) and the individual asymptotic-size distribution (IASD), are labelled. The dashed line in the individual size distribution indicates the part of the plot to which organisms with m∞ < 1 kg contribute. (b) The log10 individual asymptotic-size distribution plotted and linearly approximated for m∞ between megg and 1000 kg, illustrating the theoretical prediction that the individual asymptotic-size distribution is approximately a power law in m∞ with exponent about −1·49.
