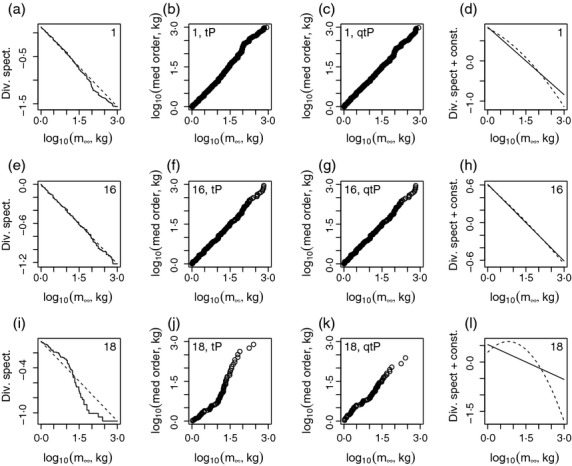
Fig 5.

Example results for testing the hypothesis that diversity spectra are linear. Empirical diversity spectra (see the section Methods for testing model predictions) and diversity spectra corresponding to fitted tP distributions for selected regions (a, e, i). Log-scale probability plots for truncated Pareto (tP; b, f, j) and quadratic truncated Pareto (qtP; c, g, k) fits. Comparison of diversity spectra corresponding to tP and qtP fits (d, h, l). Panels are as follows: a–d, the global region (all 63 LMEs combined); e–h, the Brazil Shelf; i–l the West Greenland Shelf. Numeric codes in the upper corners also identify regions – Tables S3 and S4 list the system names that correspond to the codes. See Fig. S11 for other regions.
