
Figure 3.
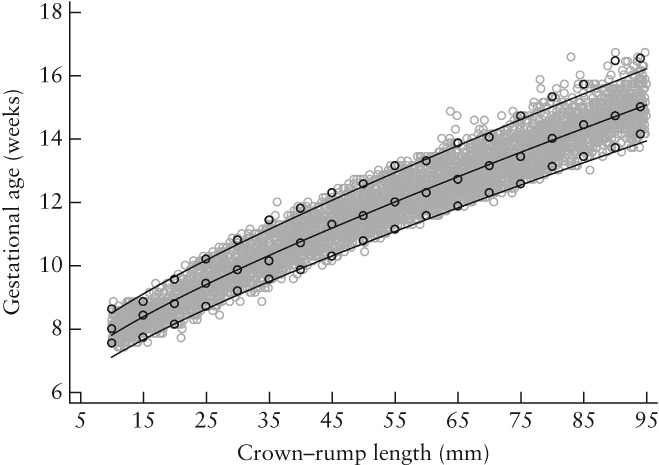
Estimation of gestational age (GA) as a function of crown–rump length (CRL). Gray open circles represent raw data and lines represent mean, 3rd and 97th centiles (±1.88 SD) of GA for a given CRL value. Black open circles represent empirical means, 3rd and 97th centiles.