
Figure 4.
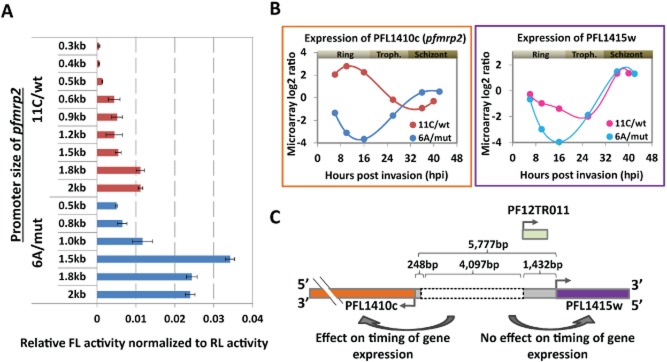
Differential promoter activity of pfmrp2 gene in clone 6A/mut and 11C/wt by luciferase reporter assay and expression profiling of pfmrp2.A. Transcriptional activity of PFL1410c (pfmrp2) promoter constructs of clones 6A/mut (blue) and 11C/wt (red) in the ring stage measured by the firefly luciferase reporter assay. Bars represent the firefly luciferase (FL) activity normalized to the level of renilla luciferase (RL) activity for each cell line transfected with each promoter construct of ∼0.3–2.1 kb from the start codon of the pfmrp2 gene. Error bars indicate the standard deviation of the FL activity over three independent transfection experiments.B. Transcriptional profiles of PFL1410c (pfmrp2) and PFL1415w genes in clones 6A/mut and 11C/wt over the 48 h asexual life cycle measured by microarray log2 ratios. Time points in terms of hours post invasion (hpi) for each clone reflect the age of the parasite as calculated from the best fit spearman rank correlations to the reference transcriptome which was previously generated (Foth et al., 2011).C. Schematic diagram depicts the location of the breakpoint sites and the deletion segment (grey dotted box) within the 5′ upstream sequence of the PFL1410c (pfmrp2) gene in clone 6A/mut compared to clone 11C/wt and relative to the neighbouring genesPFL1415w. The numbers represent the distances between the deletion break points and the start codons of both PFL1410c (pfmrp2) and PFL1415w genes. A non-coding RNA, PF12TR011 (light green box), is potentially transcribed within the 1432 bp upstream of the PFL1415w (PlasmoDB version 9).