
Fig 7.
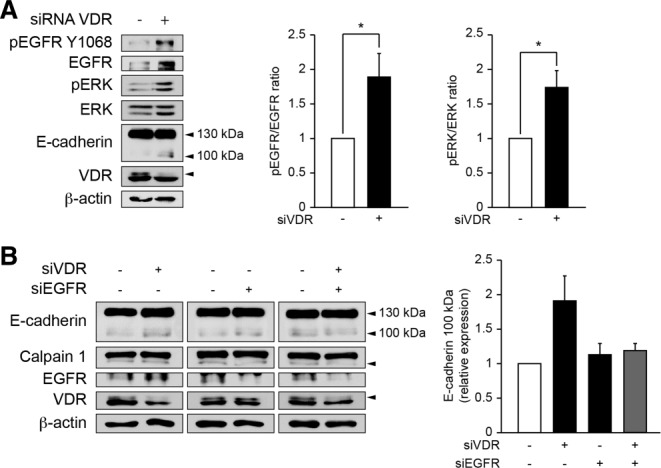
EGFR-signaling in biliary epithelial cells with diminished VDR expression. (A) Biliary epithelial cells were transfected either with scramble or VDR siRNA for 3 days. Total protein extracts were then submitted to pEGFR Y1068, EGFR, pERK, ERK, E-cadherin, VDR, and β-actin immunoblot. Histograms represent the densitometric analysis of the pEGFR to EGFR ratio and of the pERK to ERK ratio. Data represent means ± SEM of six independent experiments. *P < 0.05. (B) Biliary epithelial cells were transfected either with scramble, VDR siRNA, EGFR siRNA, or a combination of VDR and EGFR siRNA for 3 days. Total protein extracts were then subjected to detection of E-cadherin, Calpain 1, EGFR, VDR, and β-actin by immunoblot. Histogram represents the densitometric analysis of relative E-cadherin 100 kDa expression. Data represent means ± SEM of three independent experiments.