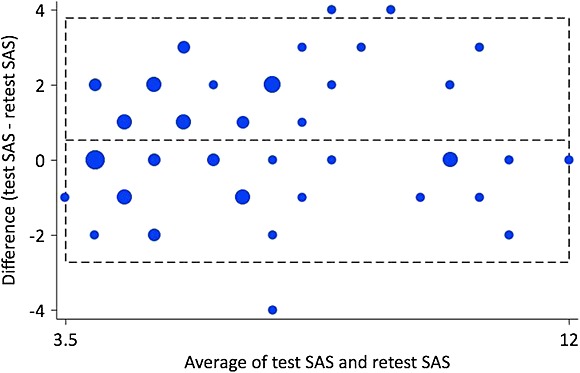
Figure 3.

Intra-individual differences (n = 60) plotted against the difference between test and retest scores on Shoulder Activity Scale. The central horizontal line represents the mean difference, whereas the flanking lines represent the 95% limits of agreement
