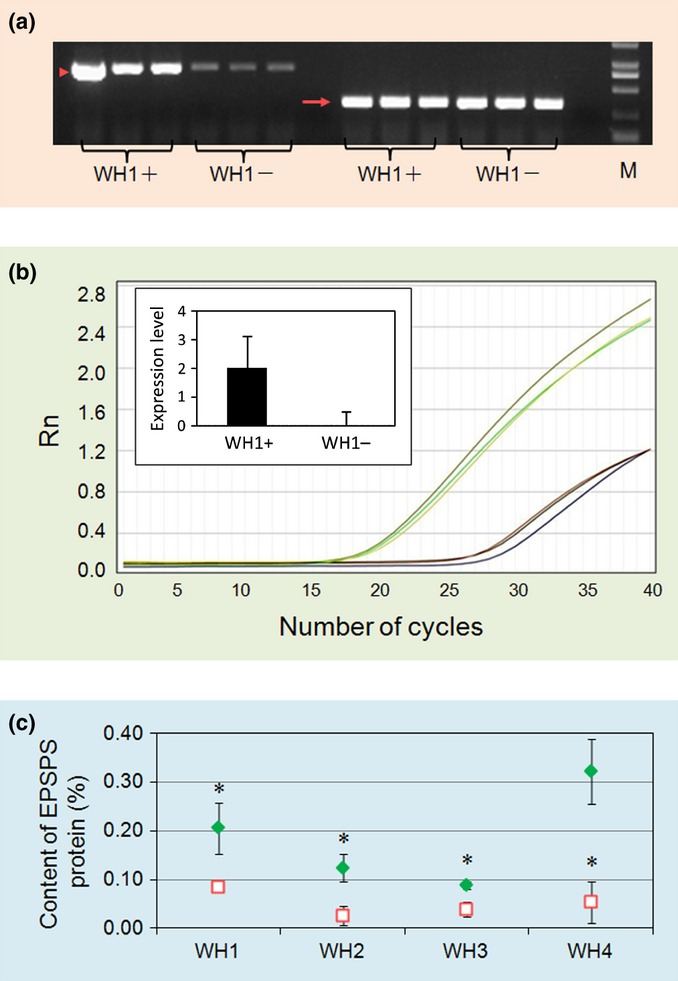
Fig 2.

Increased expression of the 5-enolpyruvoylshikimate-3-phosphate synthase (epsps) gene and EPSPS protein content in transgenic F2 crop–weed (Oryza sativa f. spontanea and O. sativa) hybrids. The four crop–weed hybrid lineages are designated WH1, WH2, WH3, and WH4. Means are shown with 1 ± SE. *, P < 0.05; **, P < 0.01; ***, P < 0.001 (t-tests with Bonferroni corrections). (a) Gene expression from epsps (arrowhead, left side) and actin control (full arrow, right side) in genetically engineered (GE) (WH1+) and non-GE (WH1−) plants; M indicates the DL2000 DNA marker; n = 3. (b) epsps gene expression in GE (upper lines) and non-GE (lower lines) WH1 plants detected by real-time PCR. Rn represents the amount of PCR produced by the epsps transgene against that by a reference gene (action) as measured based on fluorescence intensity, shown with the number of PCR cycles. The inserted bar chart represents the relative levels of gene expression when WH1− was set as 1. The y-axis shows the logarithm-transformed (log10) gene expression level; n = 3. (c) Mean percentage of relative EPSPS protein content of GE (green symbols) and non-GE plants (red symbols), determined by enzyme-linked immunosorbent assay (ELISA); n = 9.
