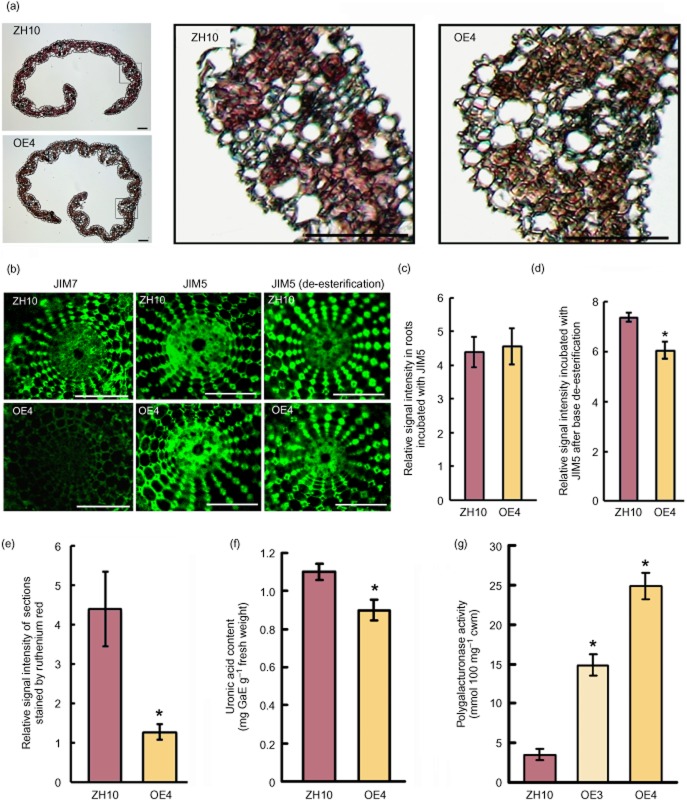
Figure 3.
Pectin and uronic acid content of cell wall fractions from OsBURP16-overexpressing transgenic and wild-type plants. (a) Cross sections of leaves of OsBURP16-overexpressing and ZH10 plants stained by ruthenium red. The black frames are enlarged in the right of the picture. Scale bar = 20 μm. (b) Immunolocalization of high- and low-methyl-ester pectin (JIM7 and JIM5, respectively) after base de-esterification in root hand sections of OsBURP16 OE4 and ZH10 seedlings. Scale bars = 100 μm. (c) Relative signal intensity of immunolocalization of low-methyl-ester pectin (JIM5) shown in (b) with ImageJ software. Ten slides each were measured. (d) Relative signal intensity of immunolocalization of low-methyl-ester pectin (JIM5) after base de-esterification shown in (b) (ImageJ software). Ten slides each were measured; asterisk indicates significant difference at P ≤ 0.05 compared with the wild type by Student's t-test. (e) Relative signal intensity of sections shown in (a) (ImageJ software). Ten slides each were measured; asterisk indicates significant difference at P ≤ 0.05 compared with ZH10 by Student's t-test. (f) Uronic acid content determined by colorimetry in wild-type and Ubi::OsBURP16 rice. The y-axis presents values for galacturonic acid equivalents (GaE) per 1 g fresh weight. Data represent means ± SD of three biological replicates. The asterisk indicates significant difference at P ≤ 0.05 compared with ZH10 by Student's t-test. (g) PG activity in leaves of ZH10 and OsBURP16-overexpressing rice (OE3 and OE4). PG activity was measured as millimoles of reducing groups per 100 mg of cell wall material (mmol·100 mg−1 cwm). Each column represents means ± SD (n = 3) of the independent measurement. Asterisks indicate significant difference at P ≤ 0.05 compared with ZH10 by Student's t-test.

