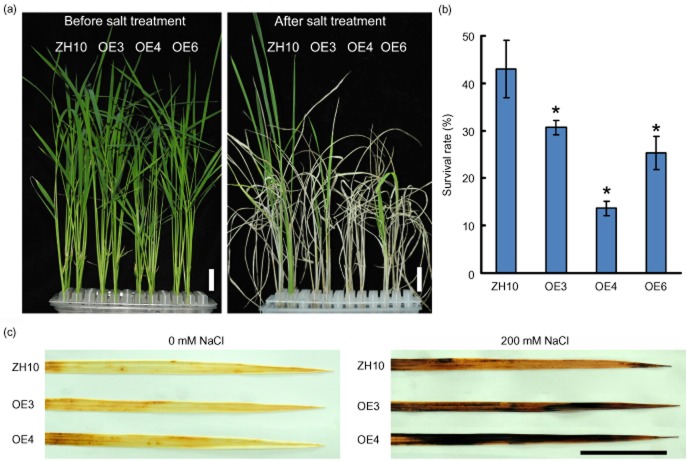
Figure 5.
Performance of Ubi::OsBURP16 transgenic rice under salt stress. (a) Plants grown for 2 weeks were treated with 200 mm NaCl for 4 d and then allowed to recover for 7 d. Scale bars = 2 cm. (b) Survival rates of the salt-treated plants after 7 d of recovery. Each column represents mean ± SD (n = 16 for each replicate) of three independent experiments. Asterisks indicate significant difference at P ≤ 0.05 compared with the wild type by Student's t-test. (c) 3,3′-Diaminobenzidine (DAB) staining of rice leaves from plants with 0 mm or 200 mm NaCl treatment for 2 d. The brown regions on the leaves are areas with high rates of DAB reaction with H2O2. Scale bar = 2 cm.

