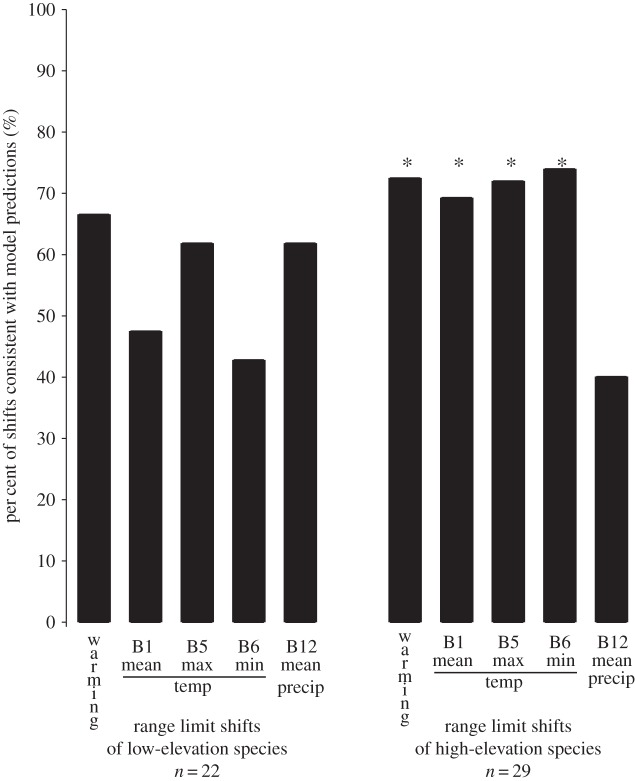
Figure 4.
Significant range limit shifts of high- and low-elevation species in relation to climate predictions. Bars represent the per cent of observed limit shifts that are consistent with the predictions from an overall warming model (i.e. all upwards) and with nearest neighbour analyses for each of the four BIOCLIM variables. Sample sizes indicate the number of range limit shifts within high- and low-elevation species that were significant from the Pfa analysis. Symbols above bars denote predictions that were significantly better than random (*p < 0.05).

