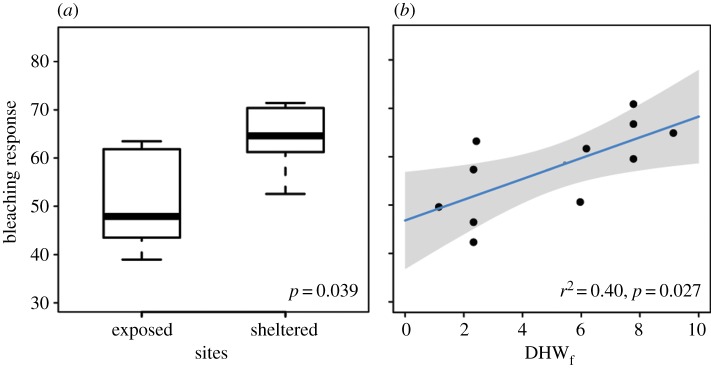
Figure 2.

Coral reef community BR to the thermal stress in May 2010. (a) Boxplots display the BR (BRM) observed for exposed and sheltered island sites (two-tailed t-test, p = 0.039; central boxes show median and 25th and 75th percentiles, and whiskers the min. and max. range). (b) BRM plotted as a function of heat stress (as degree heating weeks from field data DHWf) for each site (solid line represents the linear regression model: r2 = 0.40, p = 0.027; the grey area denotes the 95% CI). (Online version in colour.)
