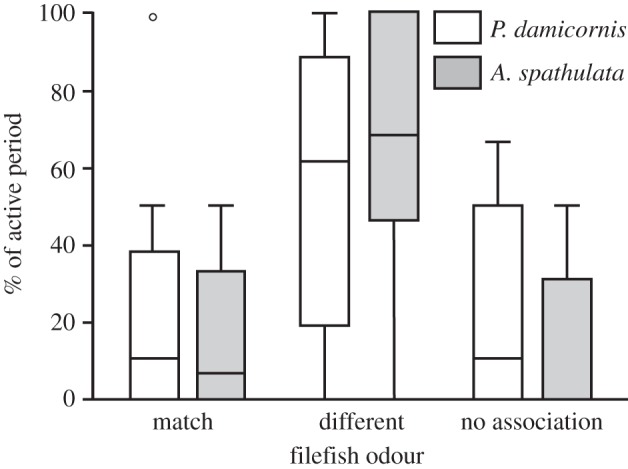
Figure 5.

Box-and-whisker plot showing relative % of cod activity spent near the odour of a filefish whose diet matched, versus one whose diet differed from, the associated coral. White bars represent P. damicornis treatment, whereas grey bars represent A. spathulata treatment. Boxes equal median and inter-quartile range, while whiskers extend to the non-outlier upper and lower data values. Points indicate outliers. In each treatment, one filefish was fed P. damicornis, and one A. spathulata. NA represents the % of activity not associated with either odour/coral combination. Trials per treatment, n = 18.
