Figure 2.

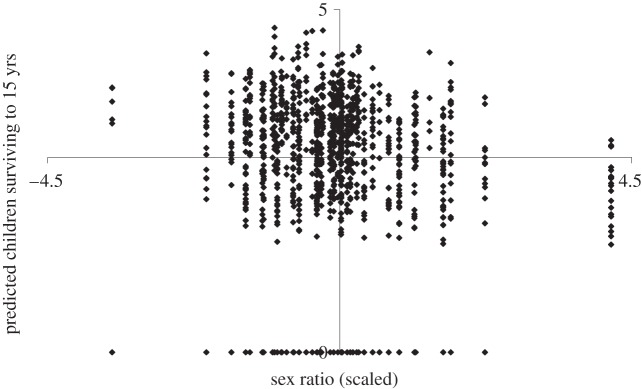
Scatter diagram of father's predicted number of children surviving to age 15 years as a function of the cohort sex ratio at birth (mean-centred at 0 and scaled in standard deviation units).

Scatter diagram of father's predicted number of children surviving to age 15 years as a function of the cohort sex ratio at birth (mean-centred at 0 and scaled in standard deviation units).