
Figure 3.
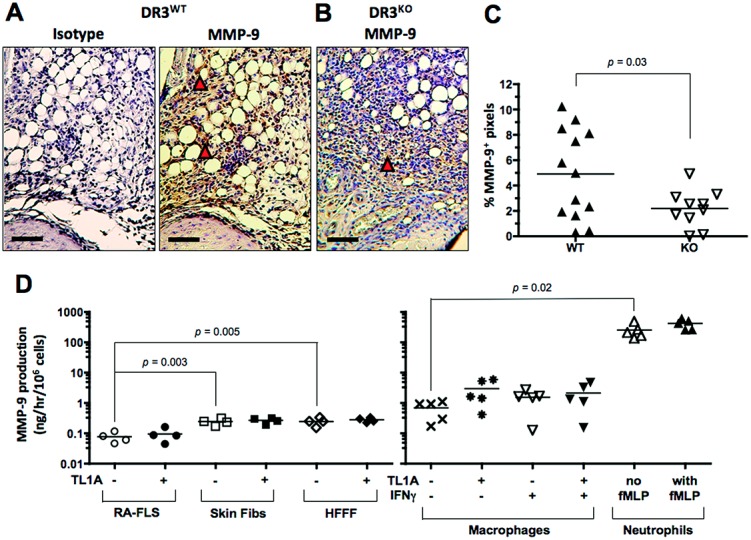
Matrix metalloproteinase 9 (MMP-9) expression in the joints of mice with antigen-induced arthritis and MMP-9 production in vitro. Arthritis was induced in WT mice and DR3−/− mice, and the joints were prepared, sectioned, and stained as described in Materials and Methods. A and B, Representative joint sections from a WT mouse (A) and a DR3−/− mouse (B, 3 days after induction of arthritis, stained for MMP-9. Arrowheads highlight areas of positive brown staining. Bars = 60 μm. C, Quantification of MMP-9 expression in WT and DR3−/− mice. D, MMP-9 production in cultures of rheumatoid arthritis fibroblast-like synoviocytes (RA FLS), healthy skin fibroblasts (fibs), human fetal foreskin fibroblasts (HFFF), macrophages, and neutrophils treated with the indicated stimuli. In C and D, each symbol represents a single mouse (C) or a single subject (D); horizontal lines show the mean. P values were determined by Mann-Whitney U test (C) and Student's t-test (D). TL1A = tumor necrosis factor–like molecule 1A; IFNγ = interferon-γ (see Figure 1 for other definitions).