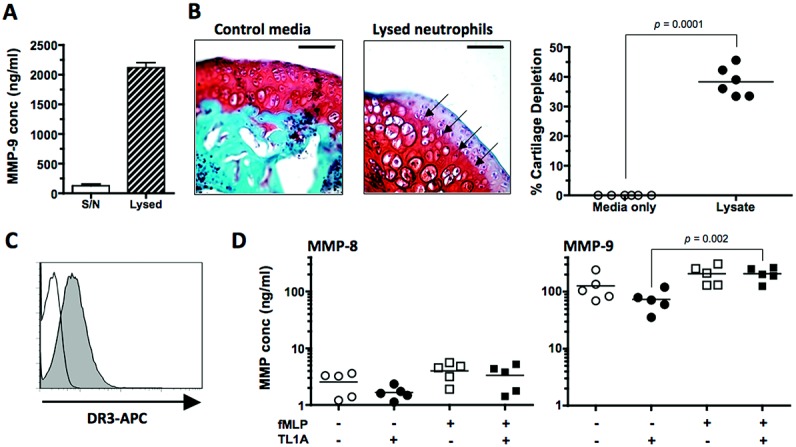
Figure 4.

Matrix metalloproteinase 9 (MMP-9) production by neutrophils. A, Concentration (conc) of MMP-9 in neutrophil culture supernatants (S/N) and lysates. Values are the mean ± SEM. B, Left, Representative whole murine patellae sections incubated with control media or neutrophil lysates. Arrows indicate the tidemark used to determine cartilage degradation. Bars = 60 μm. Right, Percentage of cartilage degradation. C, Histogram showing death receptor 3 (DR-3) expression on neutrophils, as determined by flow cytometric analysis. D, MMP-8 and MMP-9 production by neutrophils following in vitro activation. In B and D, each data point represents a single culture; horizontal lines show the mean. P values were determined by Mann-Whitney U test (B) or Student's t-test (D). TL1A = tumor necrosis factor–like molecule 1A; APC = allophycocyanin.
