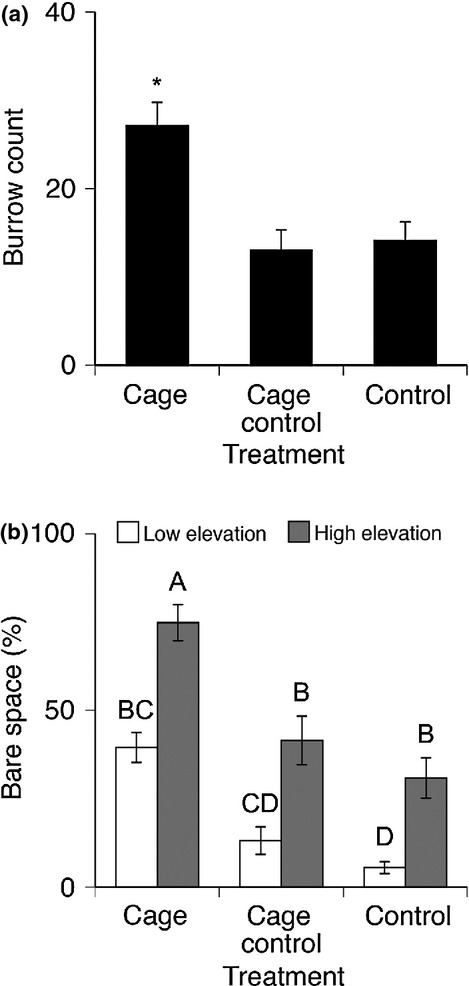
Figure 3.

End of season pooled subquadrat (0.5 m2) burrow counts (a) revealed that there were significantly more burrows in caged plots than cage control and control plots (*Denotes significant difference, Tukey HSD). Bare space (b) was also higher in caged plots than cage control and control plots, and overall bare space was higher at high elevations along the grazing border (Letters, Tukey HSD).
