
Figure 1.
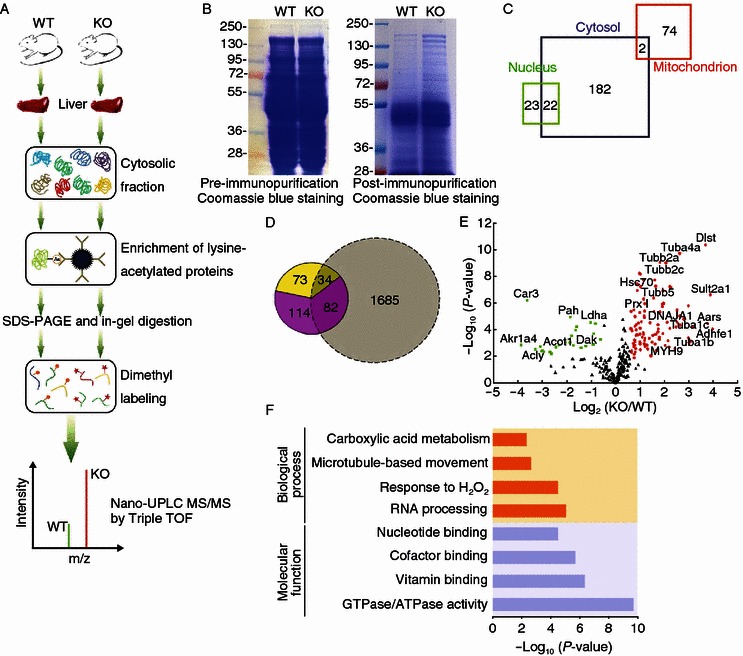
Experimental strategy for the identification of HDAC6-regulated acetylated proteins in mouse liver tissues. (A) Schematic of the experimental workflow. Cytoplasmic proteins extracted from the liver tissues of wild-type and HDAC6 knockout mice were subjected to immunopurification, SDS-PAGE, in-gel digestion, and isotope labeling followed by 1D LC-MS/MS analysis. (B) Coomassie blue-stained SDS-PAGE of cytoplasmic protein extracts prior to (left panel) or post (right panel) immunopurification with an antibody against acetylated lysine (AcK). (C) Cellular compartment distribution of 303 quantified proteins in our dataset. (D) Overlap of lysine-acetylated protein identification between our dataset (in color) and a large MEF acetylome dataset reported by the Zhao’s group (Chen et al., 2012) (grey). The fraction of potential HDAC6 substrates (yellow) is entailed in the total of quantified proteins in our study (pink). (E) Scatter plot showing the relative quantification of lysine-acetylated proteins in relation to significance of the protein ratio. Red and green dots represent proteins with increased or decreased acetylation abundance in HDAC6 knockout vs. wild-type mice, respectively. Black dots represent proteins with no significant changes in acetylation levels. (F) Representative biological processes and molecular functions significantly enriched in proteins with altered acetylation levels in HDAC6 knockout vs. wild-type mice, suggested by ontology annotation