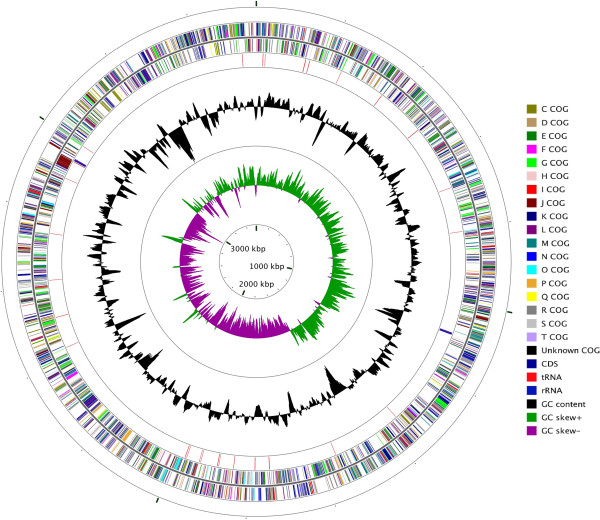
Figure 3.
Circular map of the chromosome of H. zincidurans strain B6T. Labeling from the outside to the inside circle: ORFs on the forward strand (colored by COG categories), ORFs on the reverse strand (colored by COG categories), RNA genes (tRNAs red, rRNAs blue), G+C content (peaks out/inside the circle indicate values higher or lower than the average G+C content, respectively), GC skew (calculated as (G-C)/(G+C), green/purple peaks out/inside the circle indicates values higher or lower than 1, respectively).

