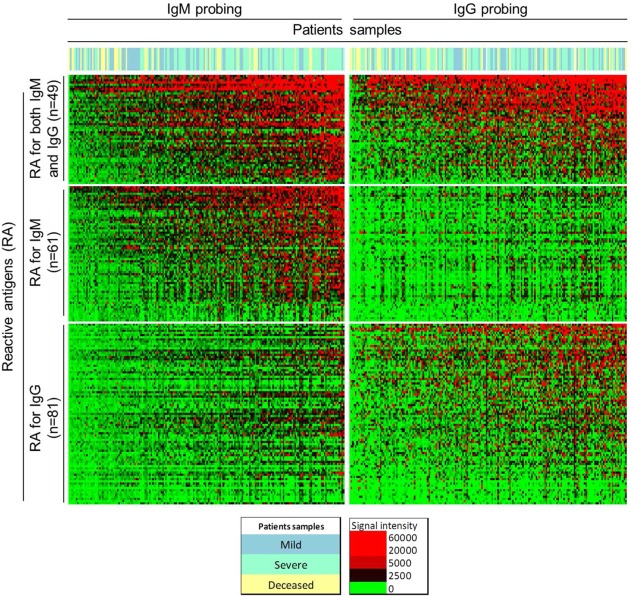
Figure 2.
Heat map showing the overall IgM and IgG reactivity detected for mild, severe, and deceased patients. Reactivity intensity is shown according to the colorized scale. Antigens are shown in rows, grouped as reactive for both IgM and IgG antibodies, or for IgM- or IgG-only antibodies; patients are in columns, organized from left to right by the increasing average reactivity detected for the reactive antigens. Samples from patients with mild leptospirosis are shown in green, patients with severe presentations are in yellow, and deceased patients are in blue.

