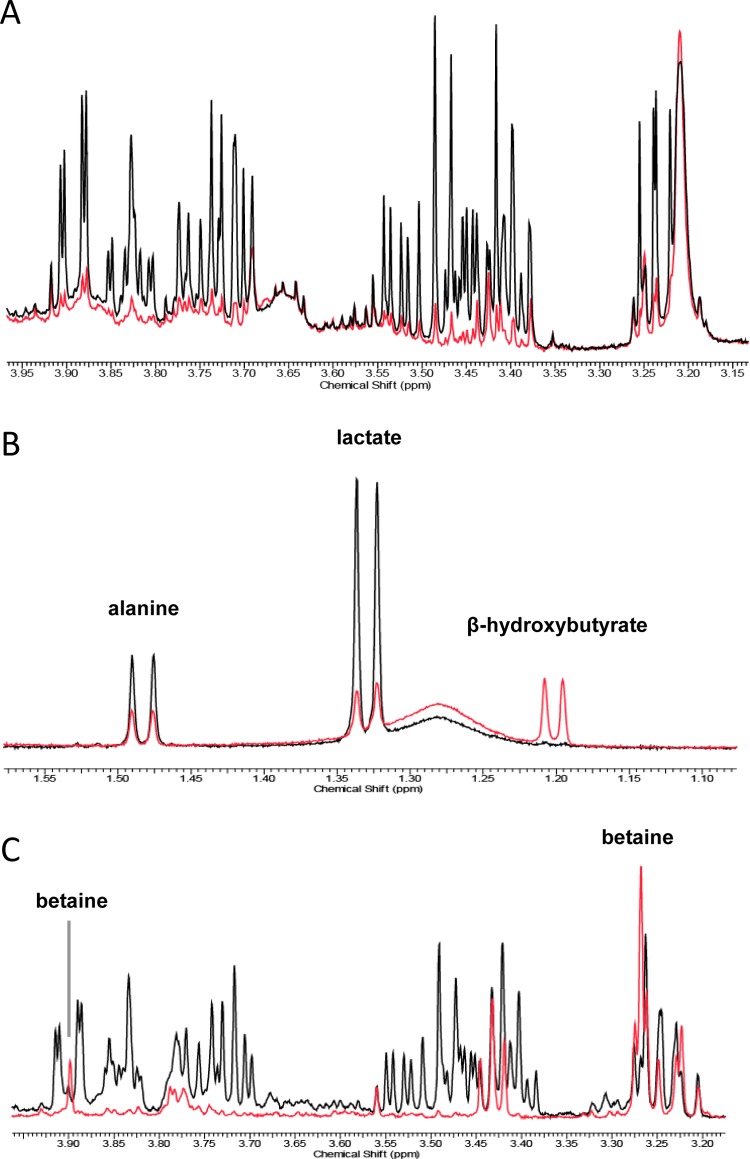
Figure 3.
Multiple sections of 1H NMR spectra showing (A) a marked reduction of serum glucose concentration (glucose region: δ 3.22–3.91) following Akt1 activation in HF/HS-fed mice, (B) an increased hepatic concentration of β-hydroxybutyrate and reductions of lactate and alanine in the DTG mice, and (C) an increased concentration of betaine and a marked reduction of hepatic glucose concentration (glucose region: δ 3.22–3.92) in the DTG mice. The NMR spectra were obtained from an individual sample of each class after 4 weeks of Akt1 activation: black spectrum, the HF/HS-fed controls; red spectrum, the HF/HS-fed DTG mice. Spectra were scaled to the same relative noise level.

