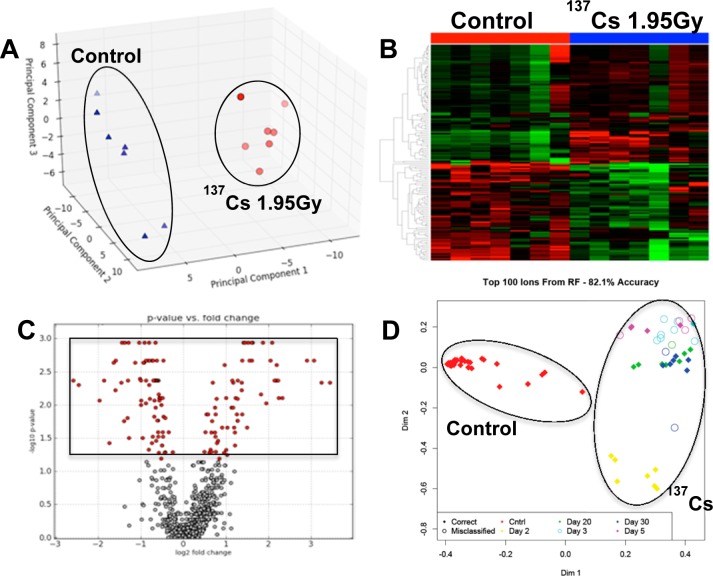
Figure 1.
Comparative analysis of serum metabolomic profiles of control mice and those exposed to 137Cs at a cumulative dose of 1.95 Gy at 2 days post-exposure. Panel A is a principle component analysis (PCA) plot showing clear separation of metabolomic signatures of sera from control (blue triangles) and 137Cs-exposed mice (red circles). Panel B is a heatmap of metabolites whose serum levels change significantly 2 days post-137Cs-exposure. The top half of this heatmap displays metabolites whose levels in serum dropped post-exposure and those of metabolites on the bottom half increased post-exposure after 2 days. Panel C is a volcano plot, which highlights many statistically significant metabolites post-exposure. Statistical significance was determined via Mann–Whitney U test (p value <0.05). Panel D is an MDS plot generated in Random Forests showing the spatial separation between the overall metabolomic profiles of serum samples from control mice and those of serum samples from 137Cs-exposed mice at 2, 3, 5, 20, and 30 days post-exposure. All of the figures were created using ESI+ data. Panels A–C were created in MetaboLyzer, while panel D was generated in Random Forests.

