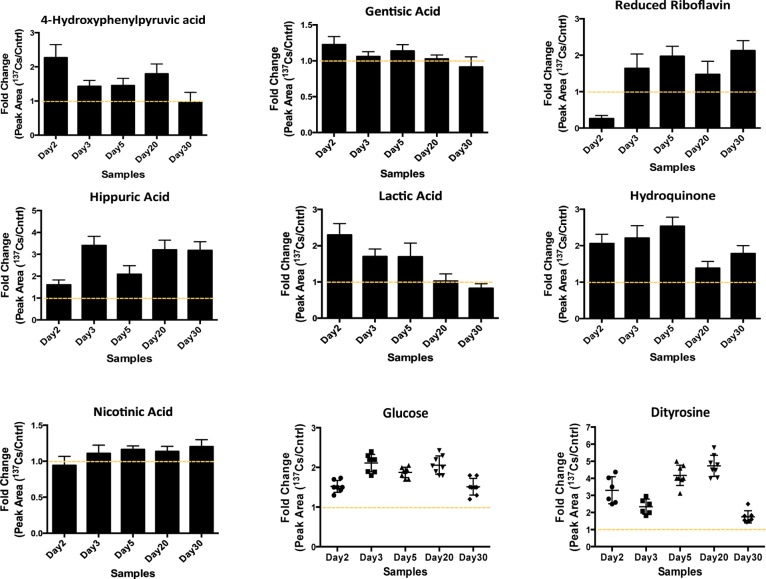
Figure 2.
Changes in the serum abundances of selected metabolites post 137Cs exposure are represented as the ratio of their responses in 137Cs-exposed mice to those in control mice. The responses were calculated as the area under the peak for each metabolite in 137Cs-treated serum divided by that in control serum (Y axis). These metabolites were selected based on their statistical significance as determined by Mann–Whitney U test (p value <0.05) and biological importance. The identities of these ions were validated via MS/MS against pure standards or through MS/MS spectra published in online databases (METLIN20 and HMDB). Tight clustering of fold-change values for glucose and dityrosine is shown at each time point.

