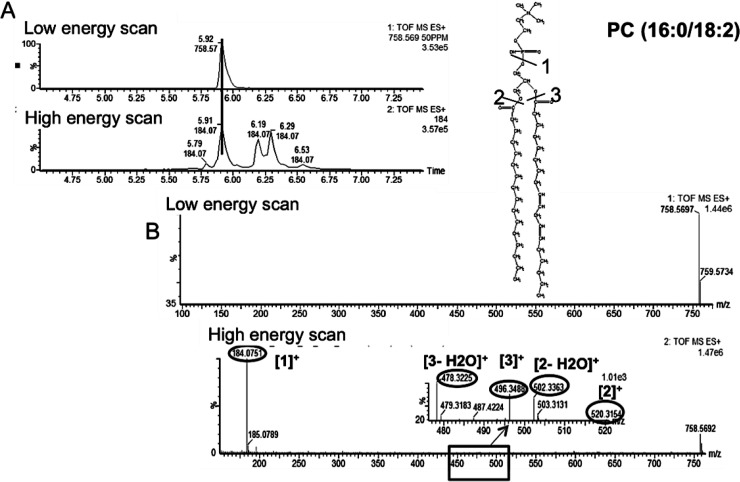
Figure 4.
Base peak of a PC and its chemical structure (top) along with its MS/MS spectrum and identified fragments (bottom). The MS/MS spectrum was obtained using described MSE method at high collision energy in ESI+ mode. The low and high energy scans were first aligned in the expected retention time window (A). The individual fragments of the precursor ion were determined by mining the high energy scan spectrum (B).

