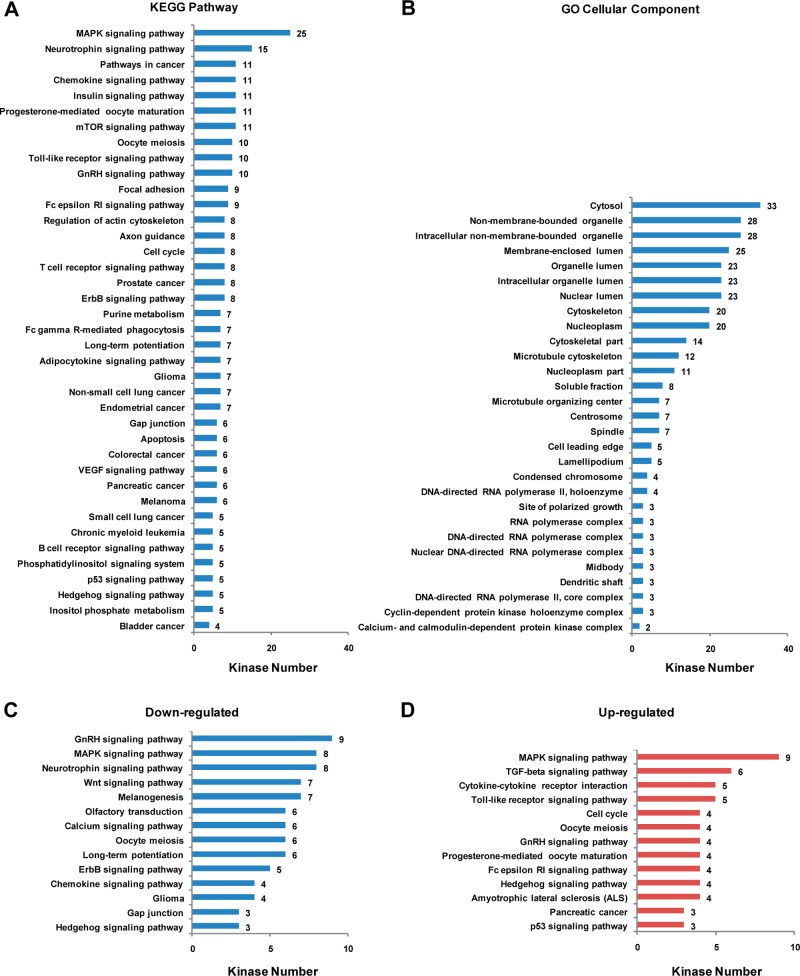
Figure 4.
GO and KEGG pathway analysis of kinases detected in the LC–MRM analysis. The number of kinases in the (A) KEGG pathways and (B) GO cellular components with p-values <0.05 are listed. Displayed are also the significantly (C) down- and (D) up-regulated kinases involved KEGG pathways in MCF-7/C6 relative to MCF-7/WT cells.

